Federal Funds Spending by Category, FY 98-99 to FY 11-12
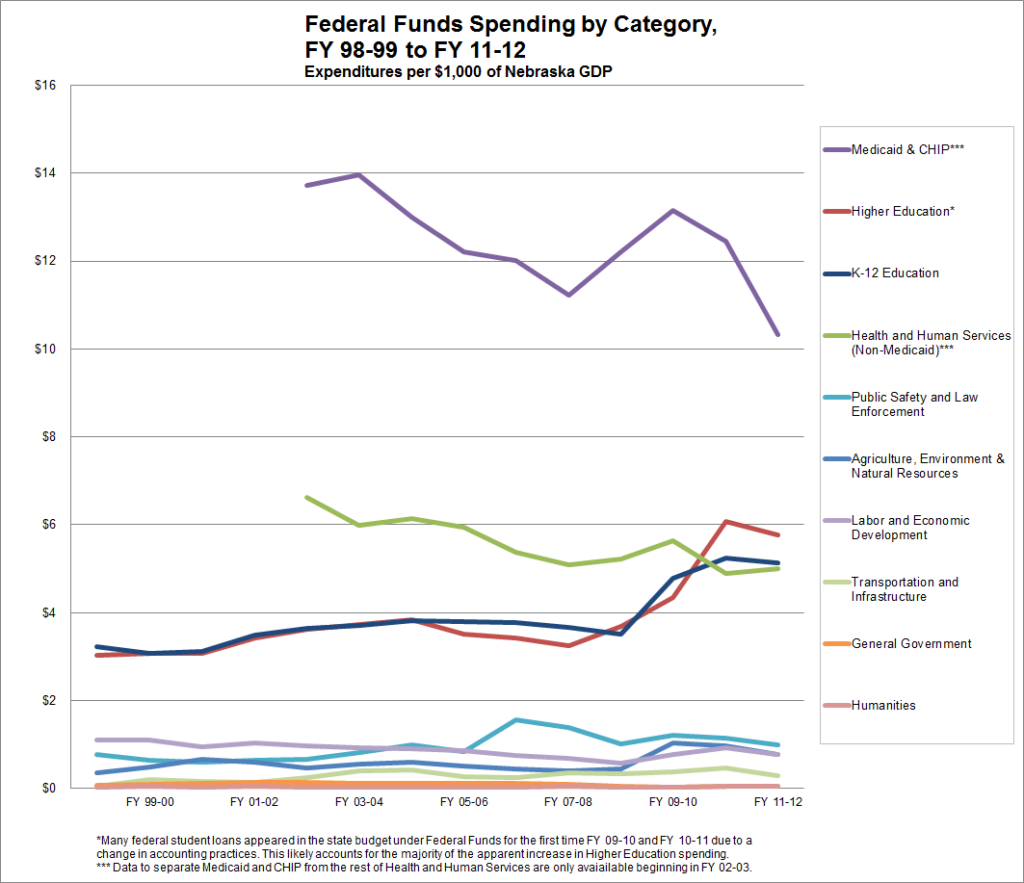
The two graphs below show trends in spending from Federal Funds as a share of the Nebraska economy for each spending category. The first graph shows all categories, while the second graph zooms in on some of the smaller categories. Click here to see this distribution as a pie graph for FY 11-12. More details are available back at our Primer Extras: Chapter 2 – State Spending page.


*Many federal student loans appeared in the state budget under Federal Funds for the first time FY 09-10 and FY 10-11 due to a change in accounting practices. This likely accounts for the majority of the apparent increase in Higher Education spending.
*** Data to separate Medicaid and CHIP from the rest of Health and Human Services are only avaiailable beginning in FY 02-03.
Sources: Department of Administrative Services Accounting Division, Legislative Fiscal Office, and US Bureau of Economic Analysis