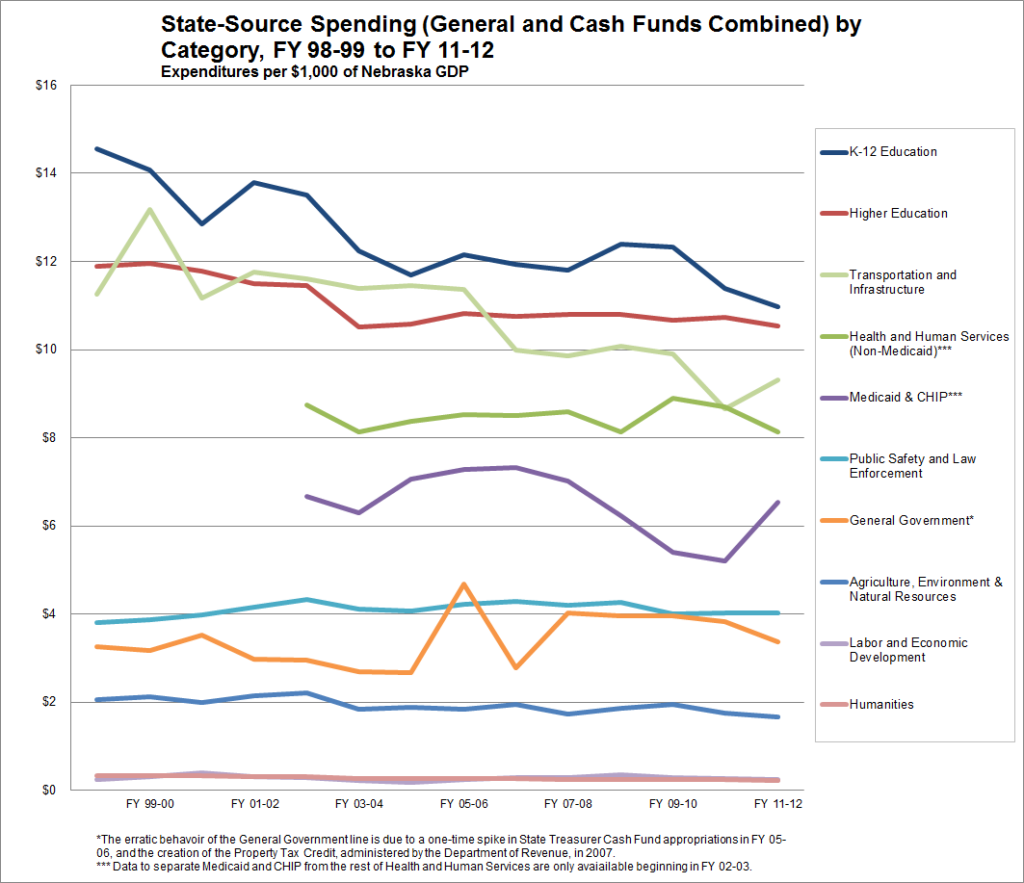
State-Source Spending (General and Cash Funds Combined) by Category, FY 98-99 to FY 11-12
The two graphs below show trends in spending from General and Cash Funds as a share of the Nebraska economy for each spending category. The first graph shows all categories, while the second graph zooms in on some of the smaller categories. Click here to see this distribution as a pie graph for FY 11-12. More details are available back at our Primer Extras: Chapter 2 – State Spending page.


Sources: Department of Administrative Services Accounting Division, Legislative Fiscal Office, and US Bureau of Economic Analysis