Policy brief — Assessment cap would create more problems than it solves
If the assessment growth cap on agricultural land proposed in LB 958 had been in effect in this year (FY16), shortfalls for schools and other localities, tax shifts and disparate impacts on agricultural land owners would have been the result.
Such unintended consequences are why the Lincoln Institute of Land Policy wrote that assessment caps are “among the least effective, least equitable, and least efficient strategies available for providing property tax relief.”[1]
For illustration purposes, this policy brief shows the impact of such a growth cap had it been in effect this fiscal year. It is important to note, however, that agricultural land valuation hit its peak of 29 percent growth between 2013 and 2014, the year of valuation on which this analysis is based.[2] Agricultural land valuation growth between 2014 and 2015 was 19 percent, and the agricultural land valuation growth projection used by the Legislative Fiscal Office to predict the future fiscal impact of this assessment cap is 8 percent.[3]
Cap is similar to taxing agricultural land at lower rate but compounds over time
The cap would have a similar impact to proposals to reduce the taxable value of agricultural land from 75 percent to 65 percent of market value. Unlike those proposals, however, the assessment cap compounds and continually separates the taxable value of agricultural land from market value. For example, had the assessment cap been in effect beginning in 2005, agricultural land would only be taxed at 30.7 percent of market value in the current year, as opposed to the current 75 percent of market value.
Shortfalls for schools, other localities
If the assessment cap in LB 958 was in effect this year (FY16), it would have created a $212 million shortfall for schools and other localities, including:
- $144 million shortfall for K-12 schools;
- $42 million shortfall for counties;
- $15 million for community colleges; and
- $11 million in losses for other local entities.
Cap would cause tax shifts, treat taxpayers differently
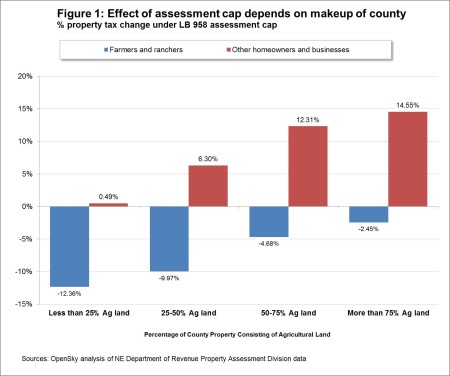
While the intent of this proposal is to help the agricultural community, the largest benefits would not go to the most rural parts of Nebraska, but rather to farmers and ranchers near urban areas. This is because the property taxes in urban areas can be shifted and shared with relatively large amounts of nearby business and residential property owners. (See figure 1)

Such tax shifts cannot occur to the same extent in more rural areas where there are not as many businesses and residential property owners. This means those communities with agricultural land must make up the lost revenue either by levy increases – which would wipe out much of the tax cut from lowering valuations – or by cuts to education, roads and other local services.
If the cap was in effect in this year, agricultural land owners in Lincoln County, where property taxes can be shifted and shared with relatively large amounts of commercial and residential properties, would have seen their property taxes reduced $208 per $100,000 of market valuation. Property taxes on other property types would have increased about $104 per $100,000 of market valuation. (See figure 2.)

In neighboring McPherson County, where there is relatively little residential and business property, levies would have had to increase almost 30 cents to avoid cuts. This would have resulted in a tax reduction for agricultural land owners of about $26 per $100,000 of market valuation – less than 13 percent of the tax cut experienced by Lincoln County agricultural land owners. McPherson County residential and business property owners, meanwhile, would have seen property taxes increase to almost $298 per $100,000 of market valuation – nearly three times greater than the tax increase experienced by Lincoln County residential and commercial property owners.
Cap won’t hold assessment growth to 3 percent for each parcel
LB 958’s assessment cap holds statewide growth of agricultural land to 3 percent per year, but it will not hold assessment growth on each parcel of agricultural property to 3 percent. Under the cap, the difference between statewide aggregate assessed agricultural land valuation and 3 percent will be calculated as a factor and applied uniformly to all agricultural land across the state. This means parts of the state could see a decline in agricultural valuations — not just slower growth. For example, charts from Nebraska’s Property Tax Administrator show 2016 agricultural land valuations under the cap would actually decrease by 2.1 percent in the southern region.[4]
Conclusion
The assessment cap in LB 958 would lead to shortfalls, tax shifts and would treat taxpayers differently based on where they live. Because of these unintended consequences, LB 958’s assessment cap is not an effective solution for addressing property taxes in Nebraska.
A methodology note
This analysis only examines the assessment cap in LB 958 as if the policy were in effect in the current year, FY15/16. It is based upon the change in agricultural land valuation between 2013 and 2014.[5] Data necessary to conduct a comprehensive analysis of the assessment cap’s impact for next year are not all presently publicly available. Data limitations also make it infeasible to conduct a comprehensive statewide analysis of the spending limits proposed in LB 958 at this time.
Download a printable PDF of this analysis.